
Exam AZ-400 Topic 4 Question 309 Discussion
Actual exam question for Microsoft's AZ-400 exam
Question #: 309
Topic #: 4
Question #: 309
Topic #: 4
You need to recommend project metrics for dashboards in Azure DevOps.
Which chart widgets should you recommend for each metric? To answer, drag the appropriate chart widgets to the correct metrics. Each chart widget may be used once, more than once, or not at all. You may need to drag the split bar between panes or scroll to view content.
NOTE: Each correct selection is worth one point.
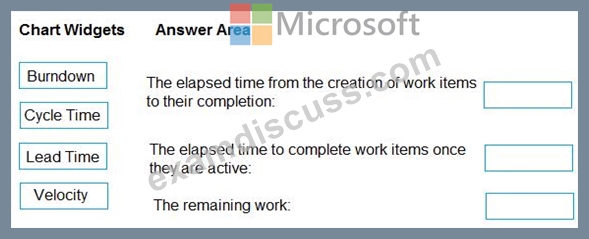
Which chart widgets should you recommend for each metric? To answer, drag the appropriate chart widgets to the correct metrics. Each chart widget may be used once, more than once, or not at all. You may need to drag the split bar between panes or scroll to view content.
NOTE: Each correct selection is worth one point.
Suggested Answer:

Reference:
https://docs.microsoft.com/en-us/azure/devops/report/dashboards/velocity-guidance?view=vsts
https://docs.microsoft.com/en-us/azure/devops/report/dashboards/cycle-time-and-lead-time?view=vsts
https://docs.microsoft.com/en-us/azure/devops/report/dashboards/configure-burndown-burnup-widgets?view=vsts
by Martin at Nov 17, 2026, 05:05 AM
0
0
0
10
Comments
Upvoting a comment with a selected answer will also increase the vote count towards that answer by one. So if you see a comment that you already agree with, you can upvote it instead of posting a new comment.
Report Comment
Commenting
You can sign-up / login (it's free).